30 Oct Mitor 2014-2015
Spectral Analysis of the Solar Wind beyond the Termination shock – Interstellar Medium/Heliosphere Interactions
The solar wind fills the heliosphere surrounding the Sun with a supersonic flow of magnetized plasma. At the border of the heliosphere, after the termination shock, the solar wind meets the denser interstellar medium. Turbulence in the solar heliosphere plays a relevant role in several aspects of plasma behaviour in space, such as solar wind generation, high-energy particle acceleration, plasma heating, and cosmic ray propagation. Most of the information about the solar wind structure comes from spacecraft that are mainly limited to a few astronomical units, so that much less is known about the structure of the external part of the heliosphere and the interaction of the solar wind with the interstellar medium. The Voyagers 1 and 2 have already crossed the termination shock (Voyager 1 in 2004, Voyager 2 in 2007), and their data show that the structure of the heliopause is much different from what was expected from most models. Our goal is to analyse the Voyager data about the plasma velocity and density, and the magnetic field data in order to extract spectral information about different cascade dynamics in the solar wind beyond the termination shock.
Participants:
MIT Kavli Center for Astrpphysics and Space Science:
- J. W. Belcher
- J. D. Richardson
Politecnico di Torino:
- D. Borgogno
- D. Tordella
- E. Magli
Politecnico di Milano:
- M. Belan
Since February 2013, the Philofluid Research Group, coordinated by Prof. Daniela Tordella, has been collaborating with researchers at the Massachusetts Institute of Technology (MIT) to advance the understanding of solar wind structure. This partnership combines MIT’s expertise in plasma physics with our group’s engineering approaches for data processing and interpretation.
In May 2013, Prof. Tordella visited MIT for an intensive exchange of data, methodologies, and experimental concepts with Dr. John Richardson. Discussions focused on the design of laboratory experiments and the analysis of Voyager 2 measurements. These efforts led to two major research proposals: one submitted to NASA’s Heliophysics Technology and Instrument Development for Science program (ROSES-2013), and another to the 2013 “Progetti di Internazionalizzazione della Ricerca” program funded by the Compagnia di San Paolo Foundation, a supporter of the MITOR program.
On September 20, 2013, Dr. Richardson delivered a well-attended seminar at Politecnico di Torino (Polito), drawing an audience of over 200 participants, including many international students. The seminar concluded with an extensive Q&A session that engaged both faculty and students.
Subsequent meetings focused on developing robust spectral analysis techniques suitable for extremely sparse datasets, specifically, cases where data availability is as low as 3% of the total possible observations. As part of these activities, Luca Gallana visited the MIT Kavli Institute (MKI) to discuss reconstruction results based on artificial datasets and Voyager 2 measurements from 1979.
Preliminary findings from this collaboration were presented at the APS Division of Fluid Dynamics Annual Meeting (November 2014) and at the Turbulence and Magnetic Fields (TMB) conference (August 2014). The team resulted in the following publications: one for the Journal of Geophysical Research and another for the European Journal of Mechanics B – Fluids.
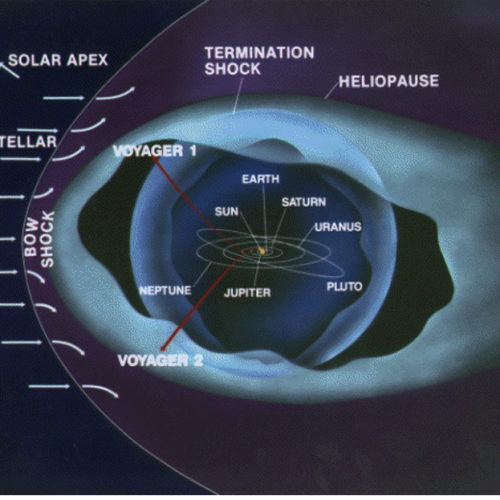
Figure 1: Scheme of the path of Voyager 1 and 2 spacecraft (from http://spacephysics.ucr.edu/index.php content=v25/v0.html). Voyager 1’s trajectory was shorter, so it reached the termination shock three years before Voyager 2.

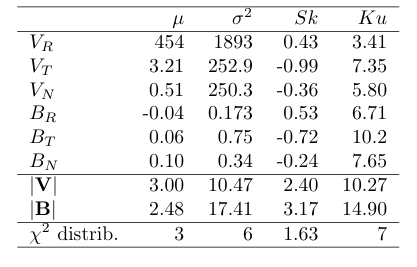
Table 1: Statistics of plasma velocity and magnetic fields in the first 180 days of 1979 computed from the Voyager 2 data ( µ is the mean value, σ ^2 the variance, Sk the skewness, and Ku the kurtosis). Velocity is measured in km/s and magnetic field in nT. Velocity and magnetic field modules are normalized with their standard deviation in order to compare them with a standard χ2-square distribution.
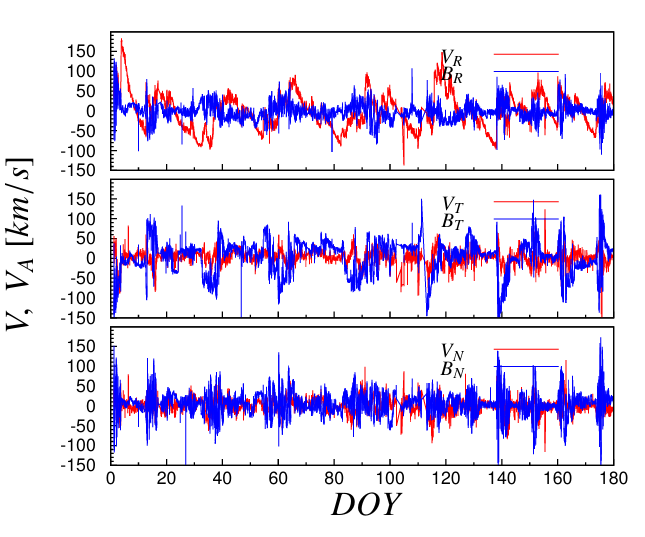
Figure 2: Instantaneous values of plasma velocity (red lines) and magnetic fields (blue lines) recorded by Voyager 2 in the first 180 days of 1979. The RTN Heliographic reference frame is used. The magnetic field is represented in terms of Alfven units in order to compare the two physical variables.
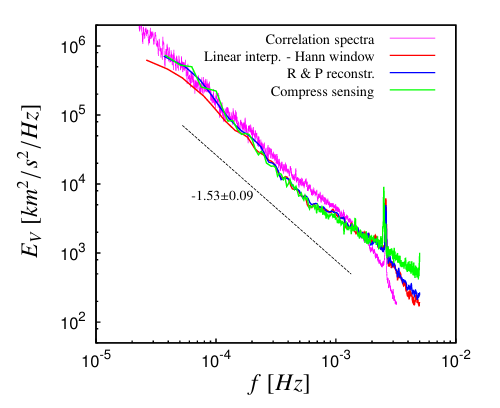
Figure 3: Recently computed spectra of the plasma velocity obtained from Voyager 2 in 1979 data (time series with about 50% missing data) by using different reconstruction methods and presented at the 3rd TMBW-2014 Workshop (Trieste, August 2014) and at the 67th APS/DFD Annual Meeting (S. Francisco, November 2014). All the methods used (two-point correlation, Rybicki & Press, compress sensing, interpolation) converge on a power law spectrum with an exponent equal to -1.53 ± 0.09 in most of the reconstructed frequency range. The peak present near f = 3.10 ^(-3) is actually a harmonic related to the instrumental sampling frequency, present in the tangential and in the normal component of velocity.
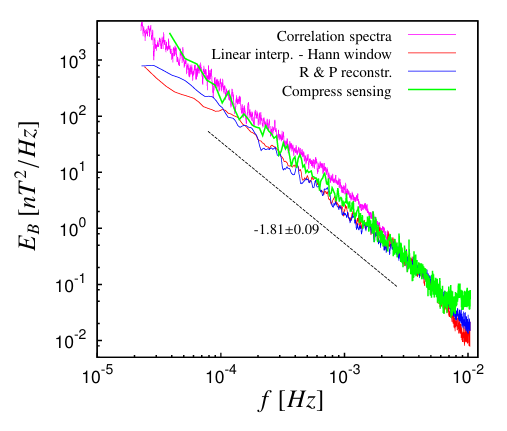
Figure 4: Recently computed spectra of the magnetic field obtained from Voyager 2 in 1979 data (time series with about 50% missing data) by using different reconstruction methods and presented at the 3rd TMBW-2014 Workshop (Trieste, August 2014) and at the 67th APS/DFD Annual Meeting (S. Francisco, November 2014). All the methods converge on a mean exponent higher than the exponent of the solar wind velocity and equal to -1.81 ± 0.09
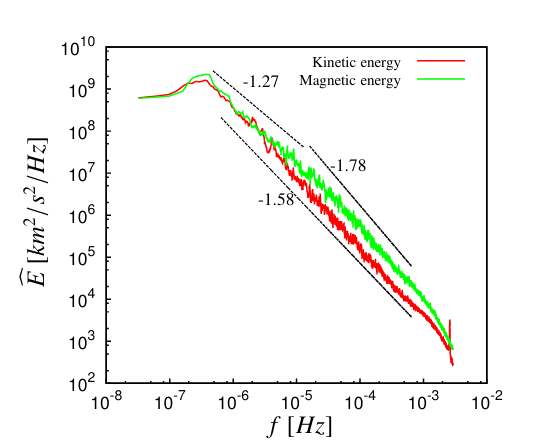
Figure 5: Spectra of velocity and magnetic field extrapolated from the full 1979 DOY 1-180 data (about 50% missing data), including all frequencies from a time period of 3 minutes to a period 180 days by using the reconstructed two-point correlations (presented at the 67th APS/DFD Annual Meeting, S. Francisco, November 2014). The exponent of the velocity field spectrum is constant in most of this range, and it is close to the Iroshnikov-Kraichnan exponent (- 3/2). Instead, the exponent of the magnetic field changes somewhere near f =2. 10^(-5) Hz (corresponding to a period T = 14 min), and at lower frequencies it becomes smaller than the plasma velocity spectrum exponent.
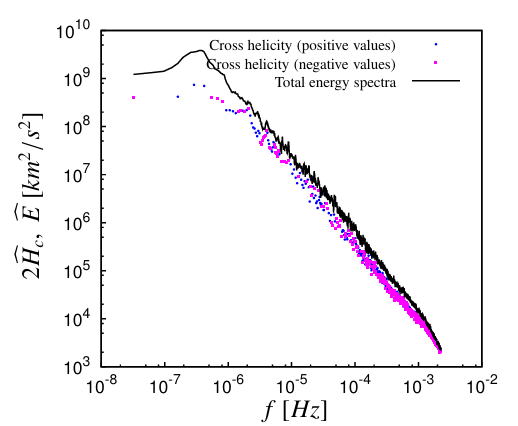
Figure 6: Reconstructed cross helicity and total energy spectra from Voyager 2 1979 data (recent result, December 2014, not yet presented). The positive and negative values of the cross helicity spectrum are almost equally distributed along the entire domain. As a consequence, the mean values of the cross-helicity are very low (less than 1% of its theoretical maximum value, which is half of the total energy), and, therefore, this indicates that the magnetic and plasma velocity fields have a low correlation level.

Figure 7: Preliminary results (December 2014) on the reconstructed energy spectra from Voyager 2 2007-2009 data (after the crossing of the termination shock). About 97% of the data is missing in the time series recorded by Voyager 2.